Debugging via XCP
Effectively Debugging Automotive ECUs in Prototypes and in the Field
In today’s automotive ECU development, software debugging and tracing as well as measurement (acquisition of internal variables of an ECU) and calibration (adjustment of internal variables) are essential techniques used during all stages of ECU development. Debug and trace tools as well as measurement and calibration (MC) tools, have been developed by different vendors in the past. In this industry, concurrent operation of multiple tools has been a necessity for many years, and the demand is ever increasing.
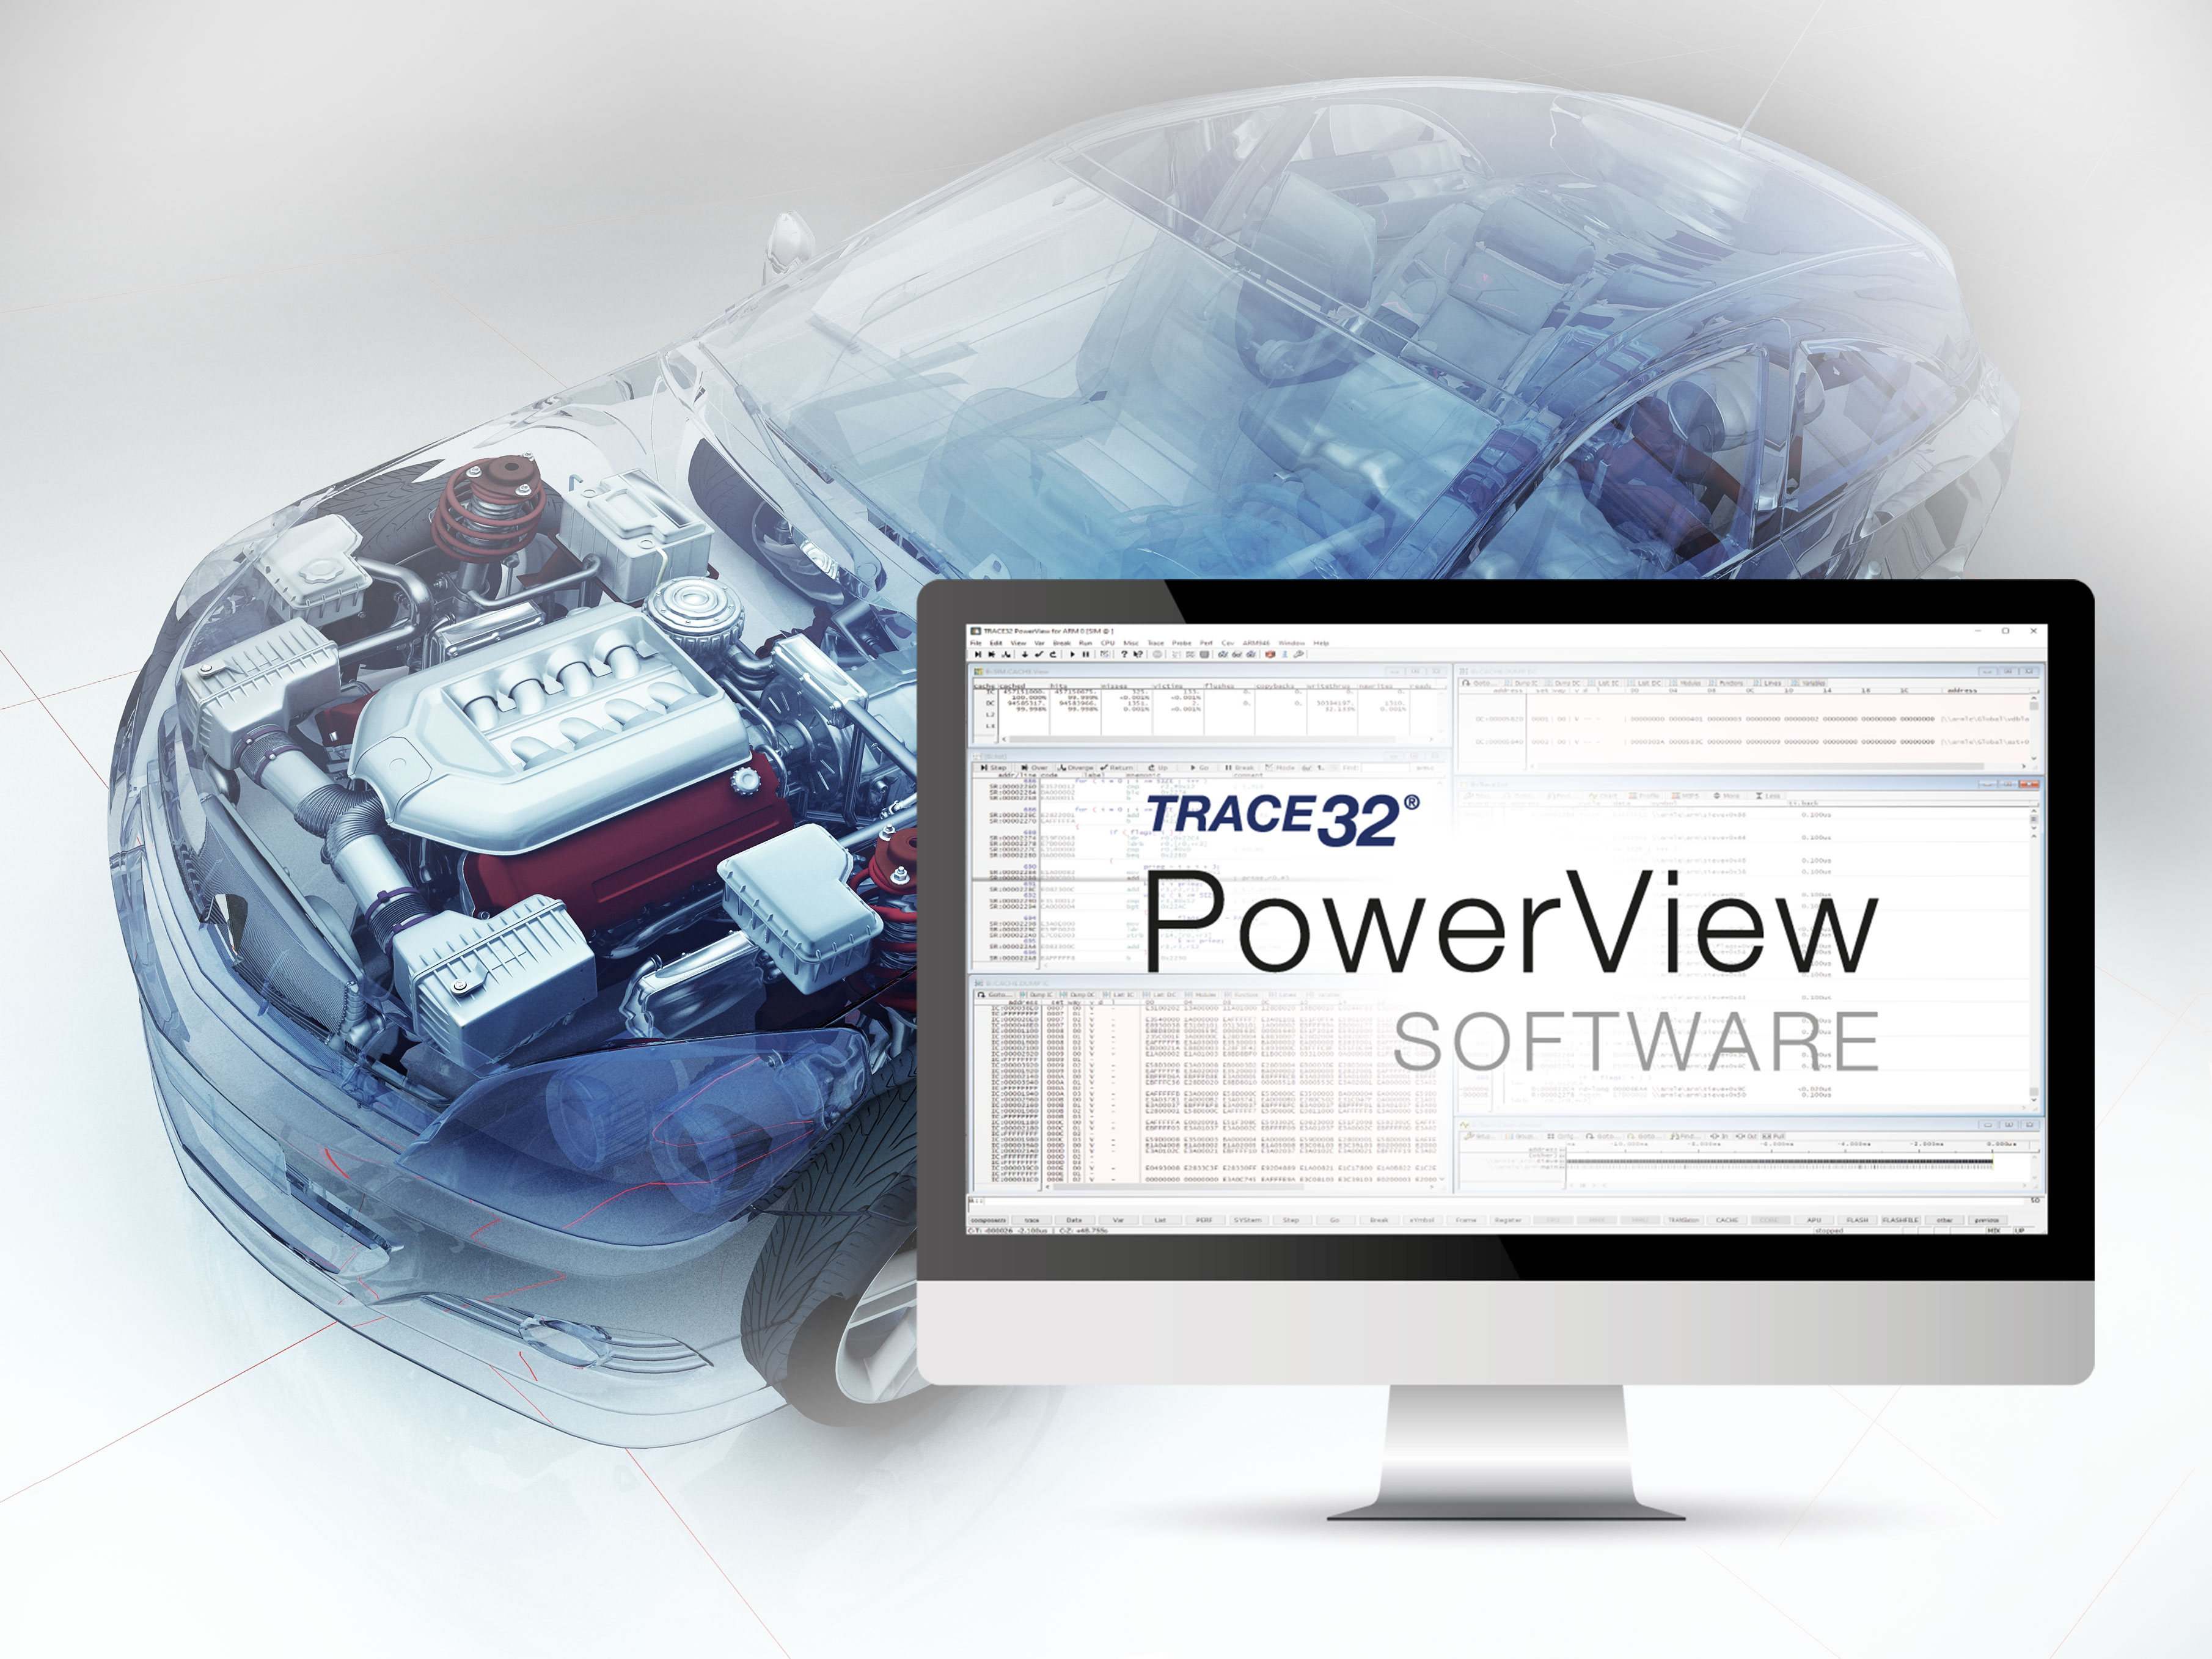
Typically, both tools rely on the same target debug interface and debug resources for ECU access. Physically switching both tools is often cumbersome or even impossible due to the mechanical setup. To overcome this challenge, software debugging via XCP (Universal Measurement and Calibration Protocol) allows debugging of an ECU concurrently to the engine calibration. Using our PowerView debug software with XCP enables you to use many of our world class debugging features such as multicore debugging, OS awareness and on-chip trace. Furthermore we support high-level language (HLL) debugging, flash programming, full peripheral register access using a descriptive menu tree and performance benchmark counters.
Use One Consistent Solution for Every Configuration
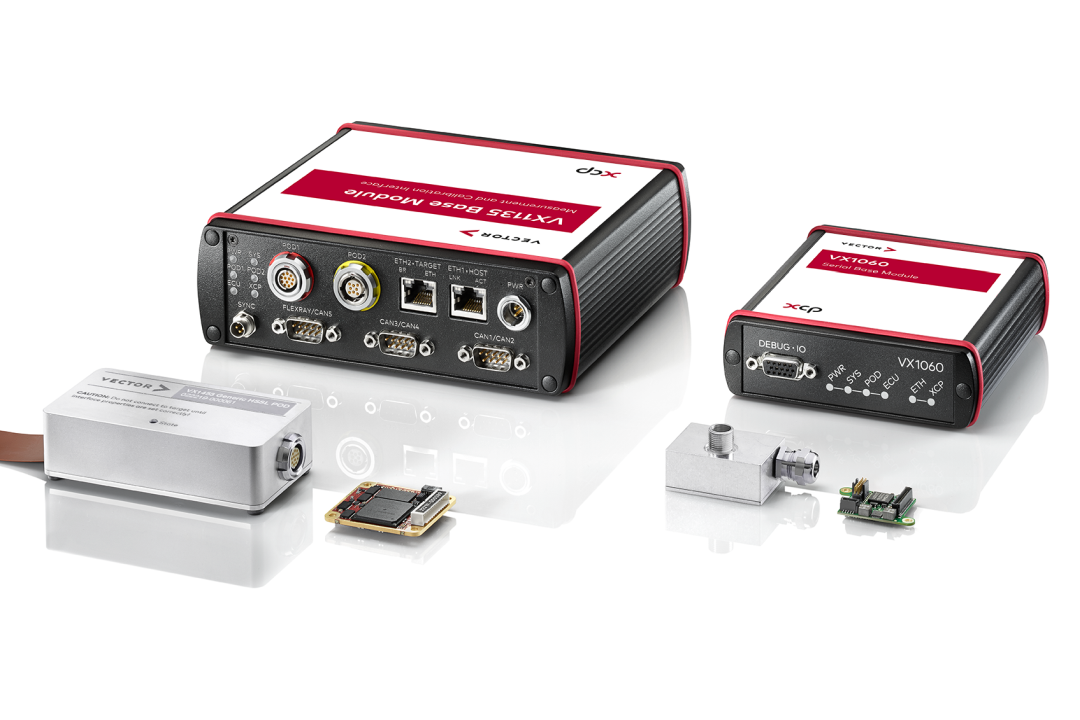
As a member of the Software Debugging over XCP Working Group, we are cooperating with major vendors of MC tools like ETAS, Vector, and dSpace. In close collaboration with our partners we have merged two previously separate processes, ECU debugging and engine data management, allowing them to utilize the same physical debug port.
Our expertise spans the majority of current and forthcoming vehicle microcontrollers, architectures, and operating systems. This enables us to support silicon designers, partners, and customers throughout the product's development cycle—particularly during prototyping and field testing.
Debug, measure and calibrate your ECU at the same time
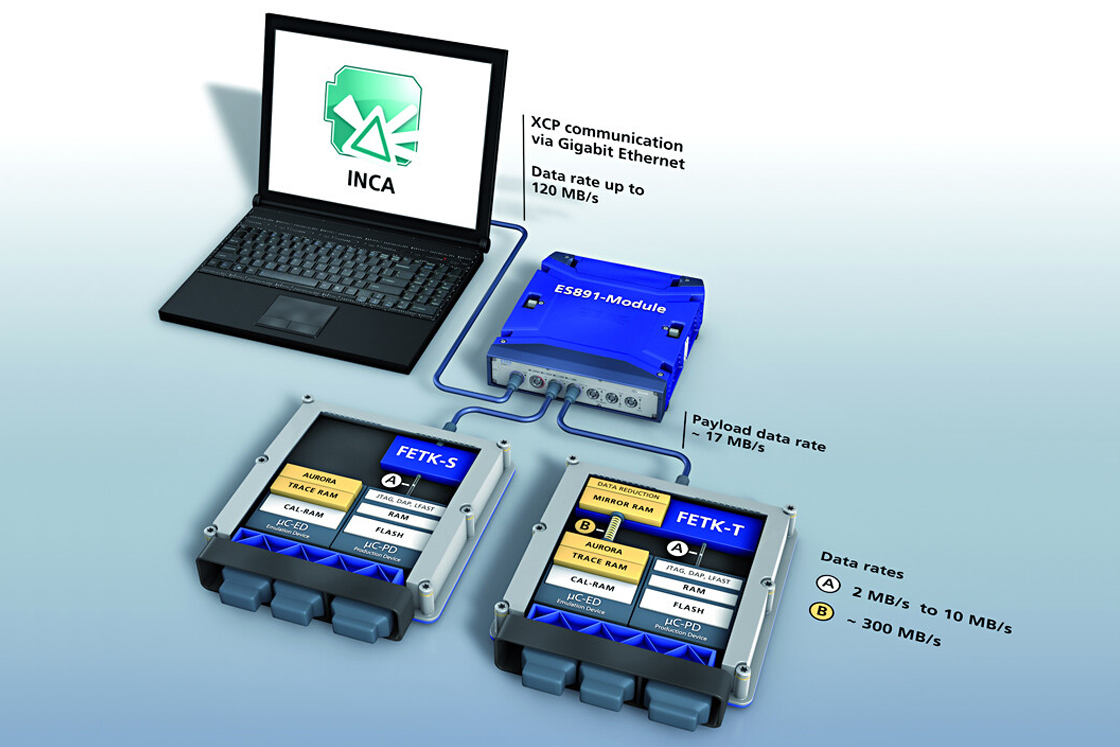
Thanks to XCP, you can now perform all your ECU development tasks without the need to switch tools or connect multiple tools at the same time. Our debugger will access the ECU´s debug port through the XCP tool, allowing to perform the same tasks as with our hardware debugger. Concur-rently, the XCP tool can collect ECU data and adjust parameters data via the target's debug port.
Save development time with our tool agnostic concept
Our XCP debugger is based on the software stack used in our PowerDebug system. Therefore, you benefit from the full feature set, the same user interface and almost the same behavior that you know from our hardware debuggers. New features implemented in future releases are and will be always compatible between the XCP debugger and the PowerDebug system.
Debug the ECU installed in your vehicle
By utilizing the infrastructure of the XCP tools, you can debug your ECU in its final housing buried deeply in the engine compartment. Effectively spot and analyze software issues which only occur in the field.
Supporting XCP for all automotive processor architectures
By using our PowerView software you can debug a variety of target CPU architectures as well as the auxiliary cores commonly used with each architecture.
A Deeper Look Into Debugging over XCP
Debugging over XCP is based on the Universal Measurement and Calibration Protocol (XCP), which is standardized by ASAM e.V. and well established for MC applications.
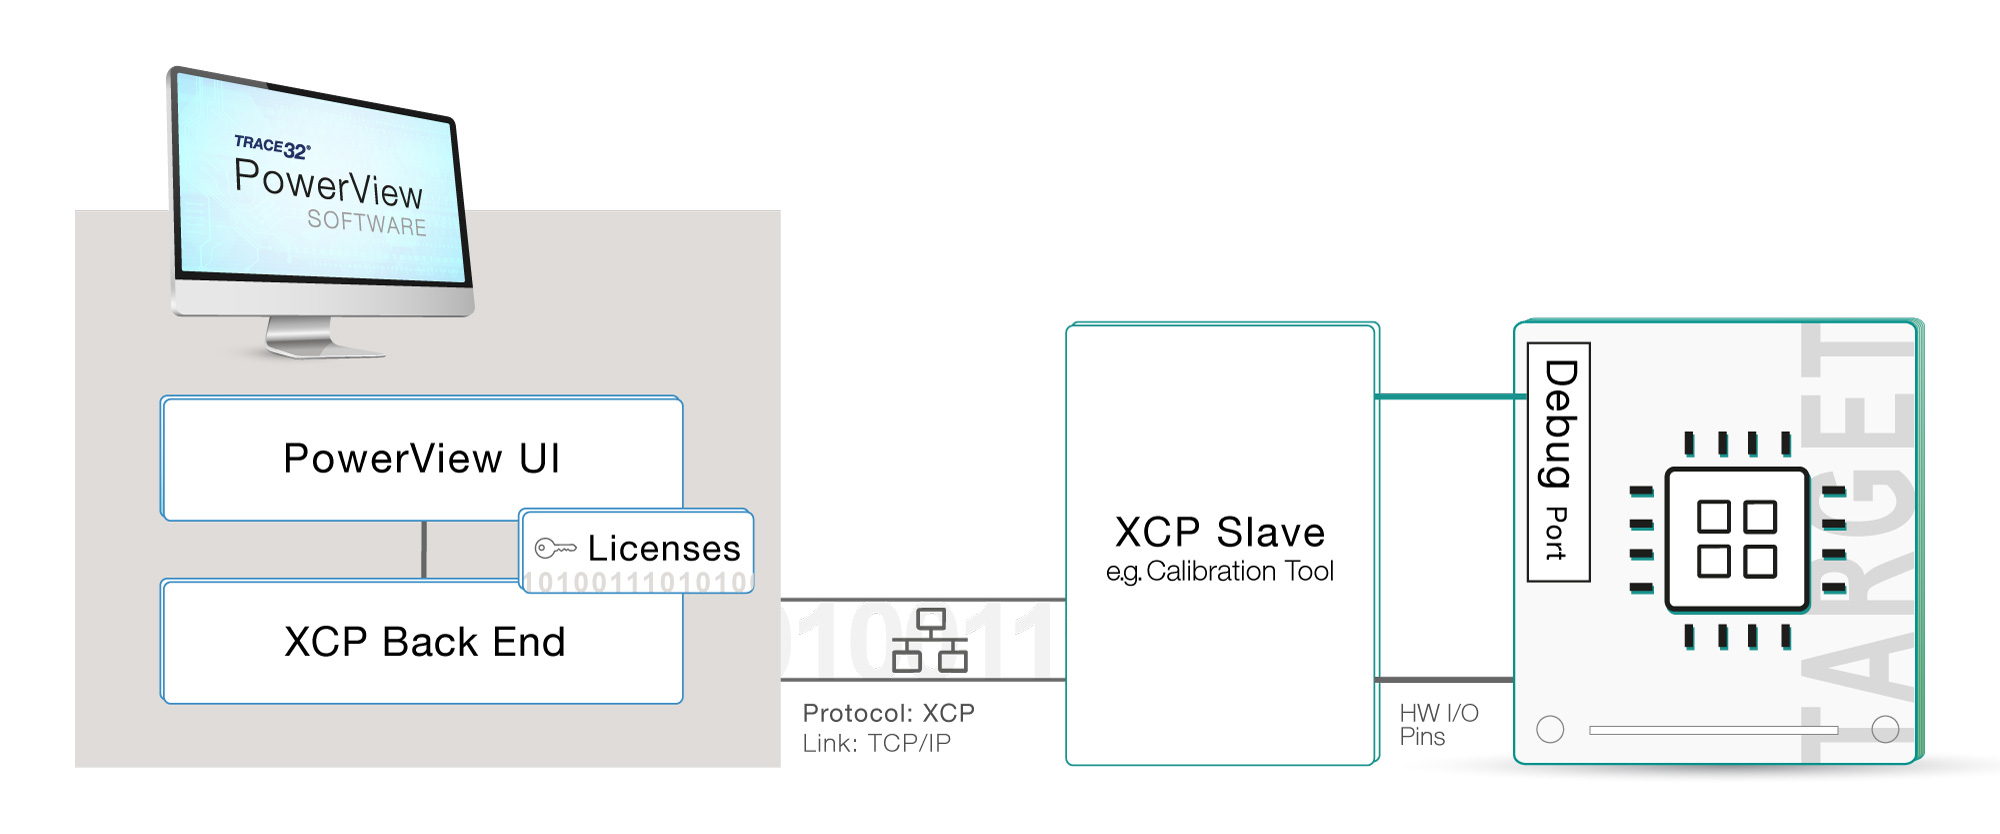
When debugging over XCP, debug commands entered via our PowerView front end are encoded into XCP commands by the XCP debug back end instead of sending them directly to the target CPU via a low-level debug protocol (e.g. JTAG, SWD or DAP). These XCP commands can either be read or write memory, perform low-level communication or access I/Os. The XCP commands are then sent over the host computer TCP stack and a network cable to the 3rd party XCP slave. The 3rd party XCP slave translates the XCP commands back into low-level debug commands.
Partnering with Major Vendors
Debugging over XCP is based on an extension of the XCP standard. This ensures interoperability between our debugger and different MC tools. As an active member of the ASAM Working Group, Lauterbach contributes to the definition and further development of the standard. We work closely with major vendors of MC tools to validate Lauterbach’s debug solutions.
Typical TRACE32 Configurations
Debug Solution for RH850
Debug your RH850 based ECU that is connected to an XCP tool.

Debug & On-Chip Trace Solution for Arm Cortex-M
Debug and trace your Arm Cortex-M based ECU that is connected to an XCP tool.

Debug & On-Chip Trace Solution for TriCore with HSM
Debug and trace your TriCore based ECU that is connected to an XCP tool. This allows concurrent debugging of all TriCore CPUs and HSM.

